To create a Visualization, follow the steps:
It is assumed that you have added your database in the Data Source page.
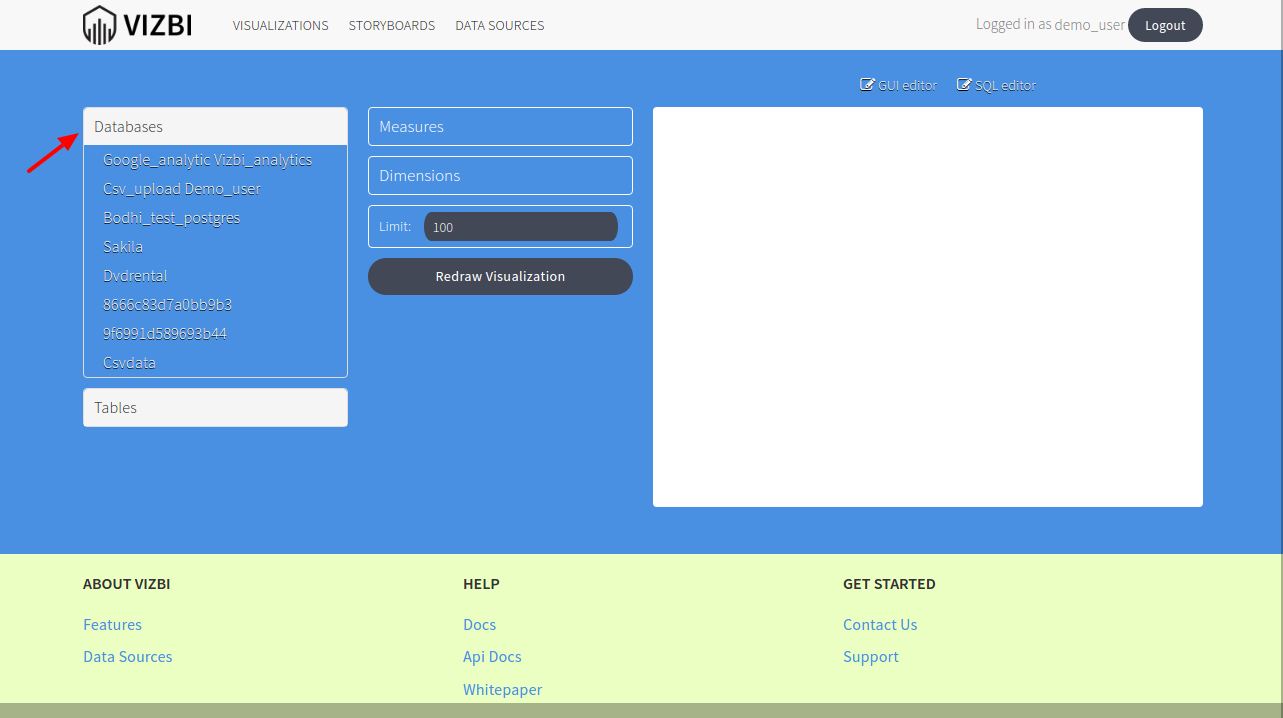
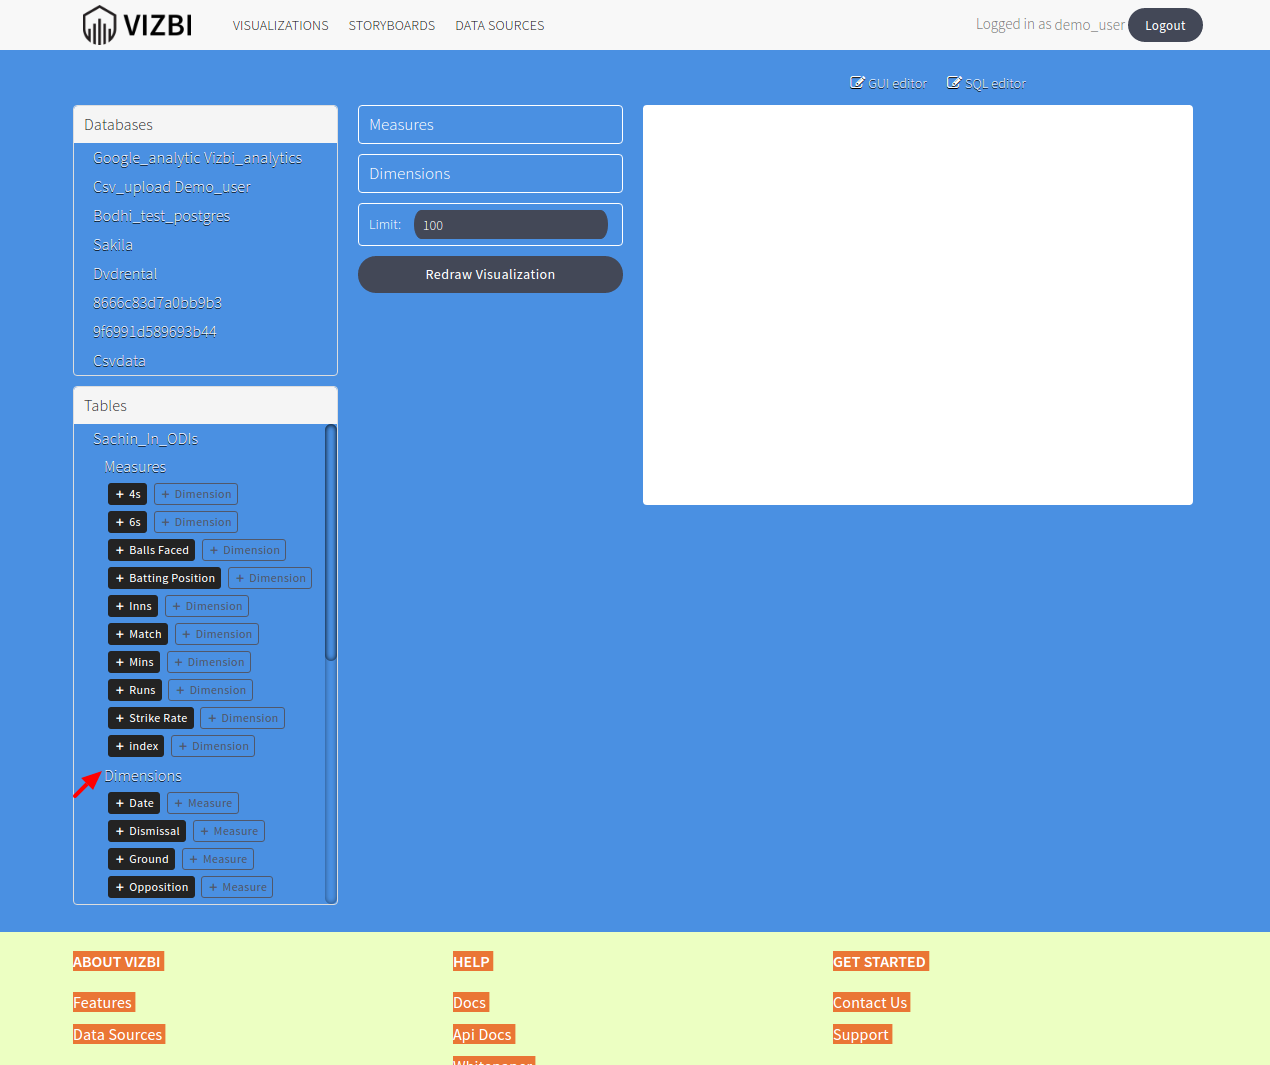
- Go to VizBI create visualization page and select your database from the Databases section on the left.
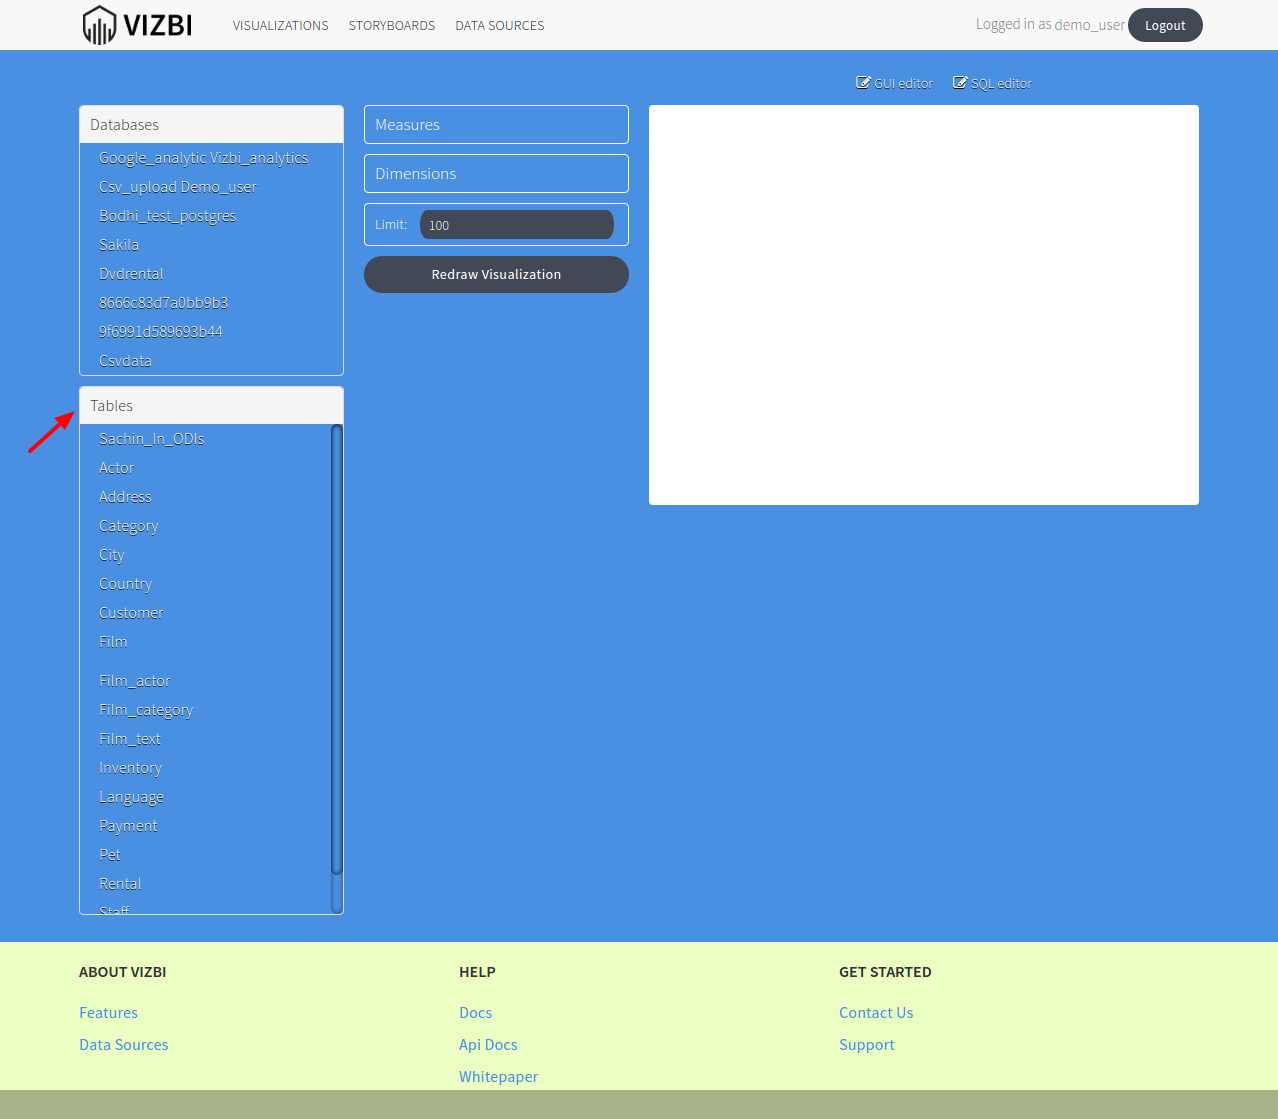
- After selecting your database, tables will be drilled down below in the Tables section for the selected database.
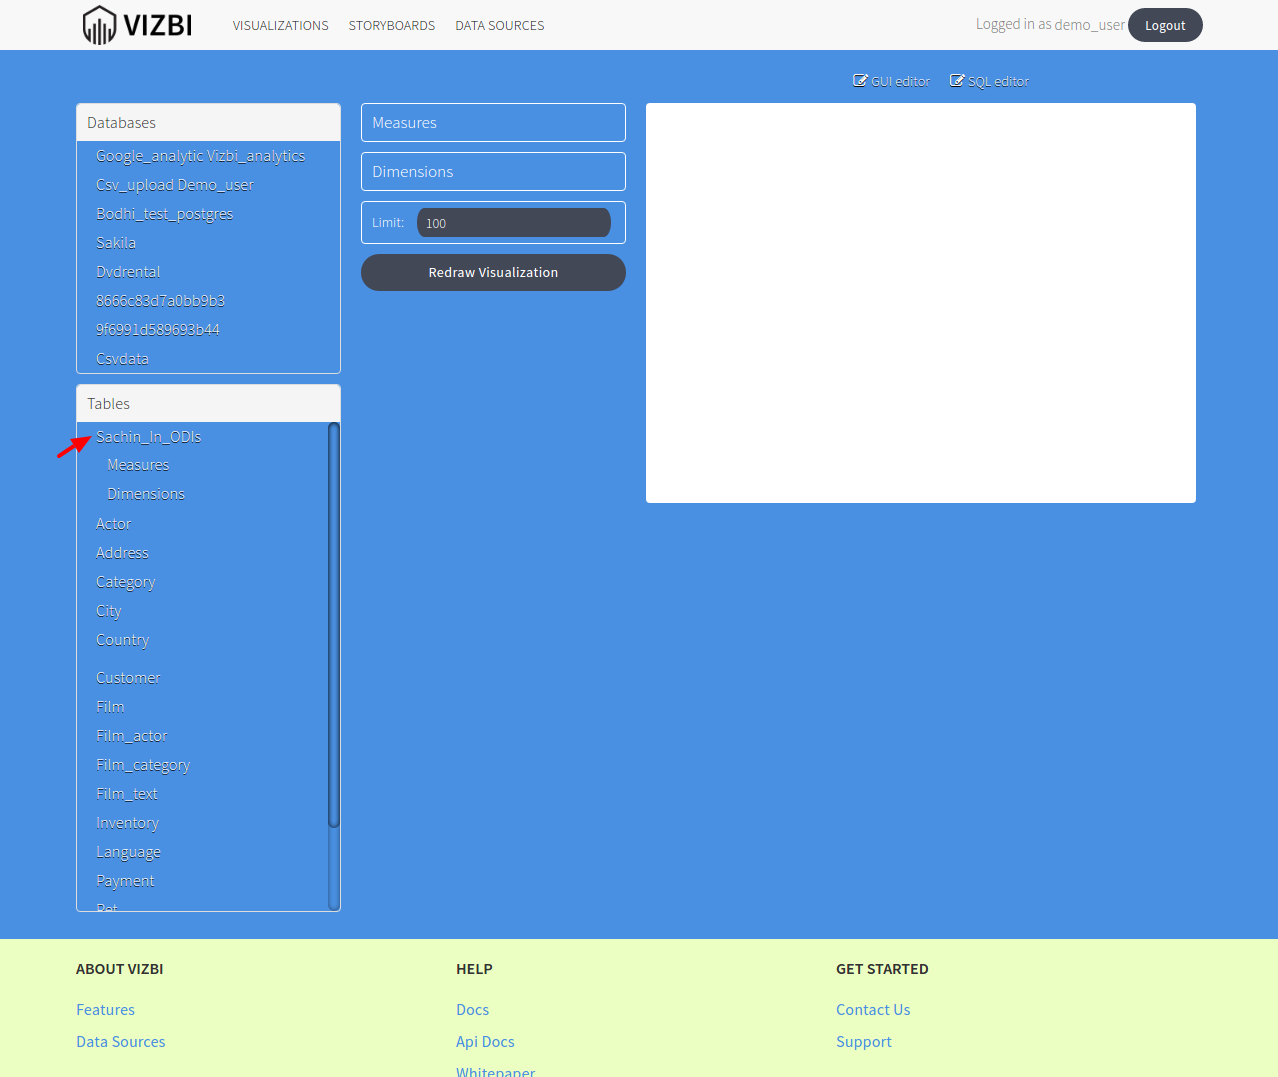
- Click on the table you want to visualize, it will show you Measures and Dimensions and then select the appropiate measures and dimension.

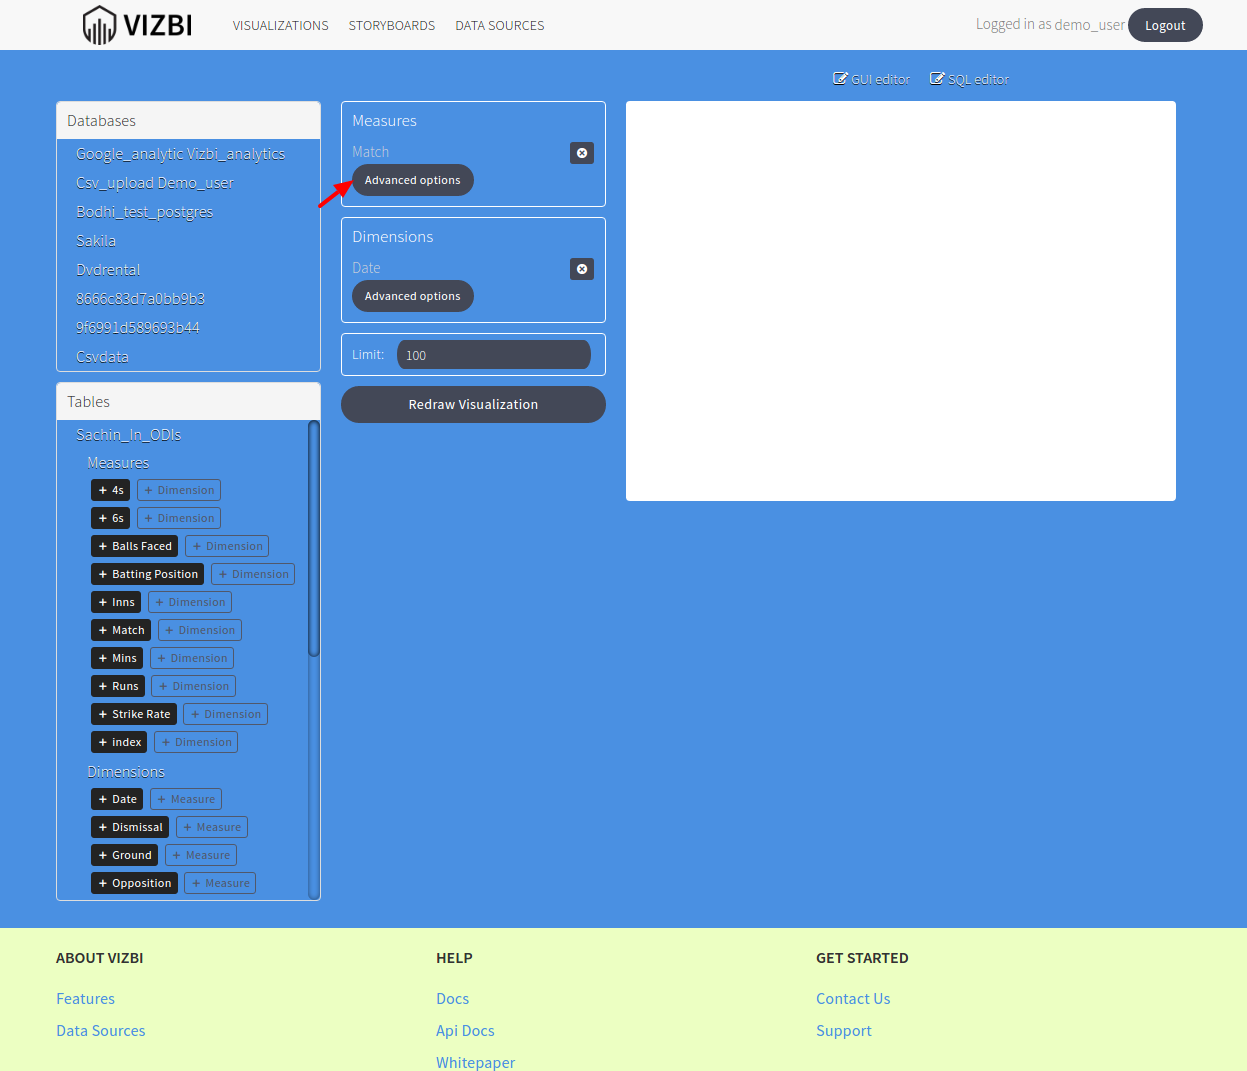
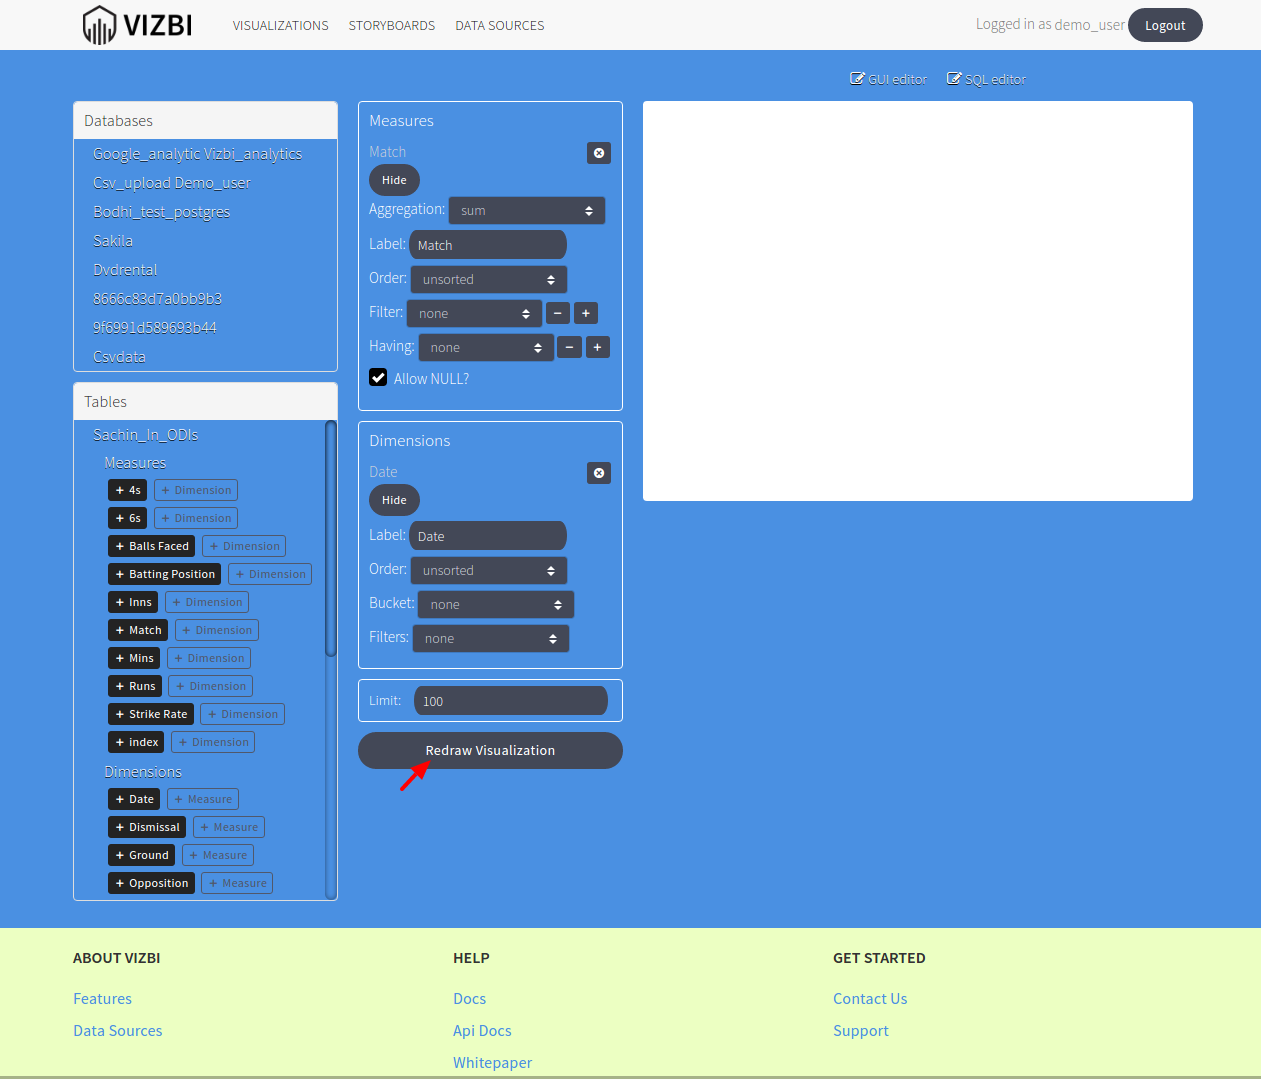
- Now you can see the measures and dimension you selected, you can click on the Advances Options for Aggregation(Sum, Count, Max, Min etc), Label to change default Label and so on.
- Click on Redraw Visualization
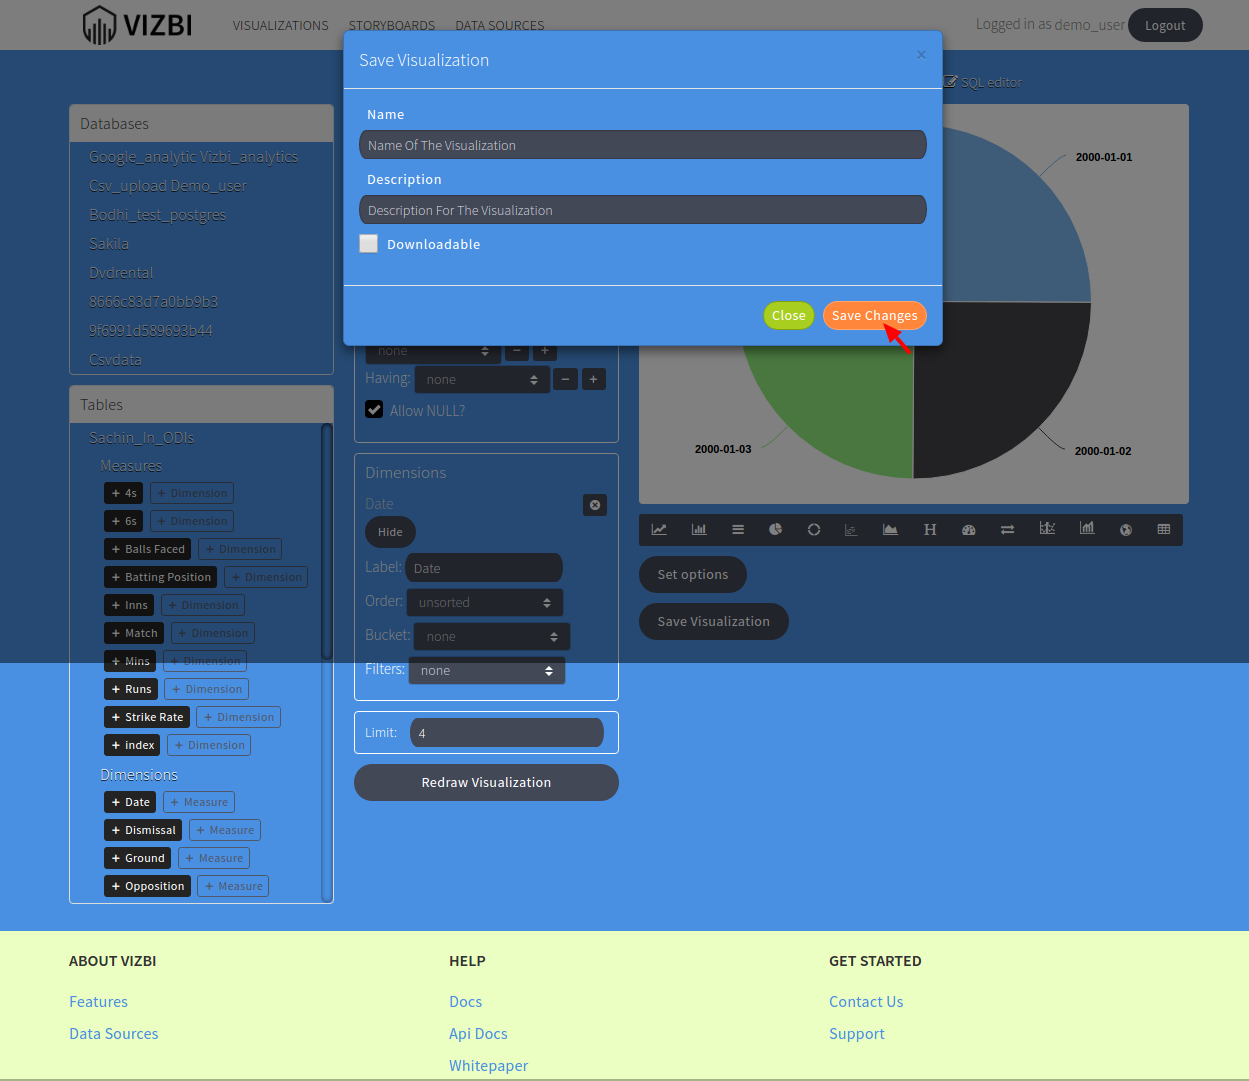
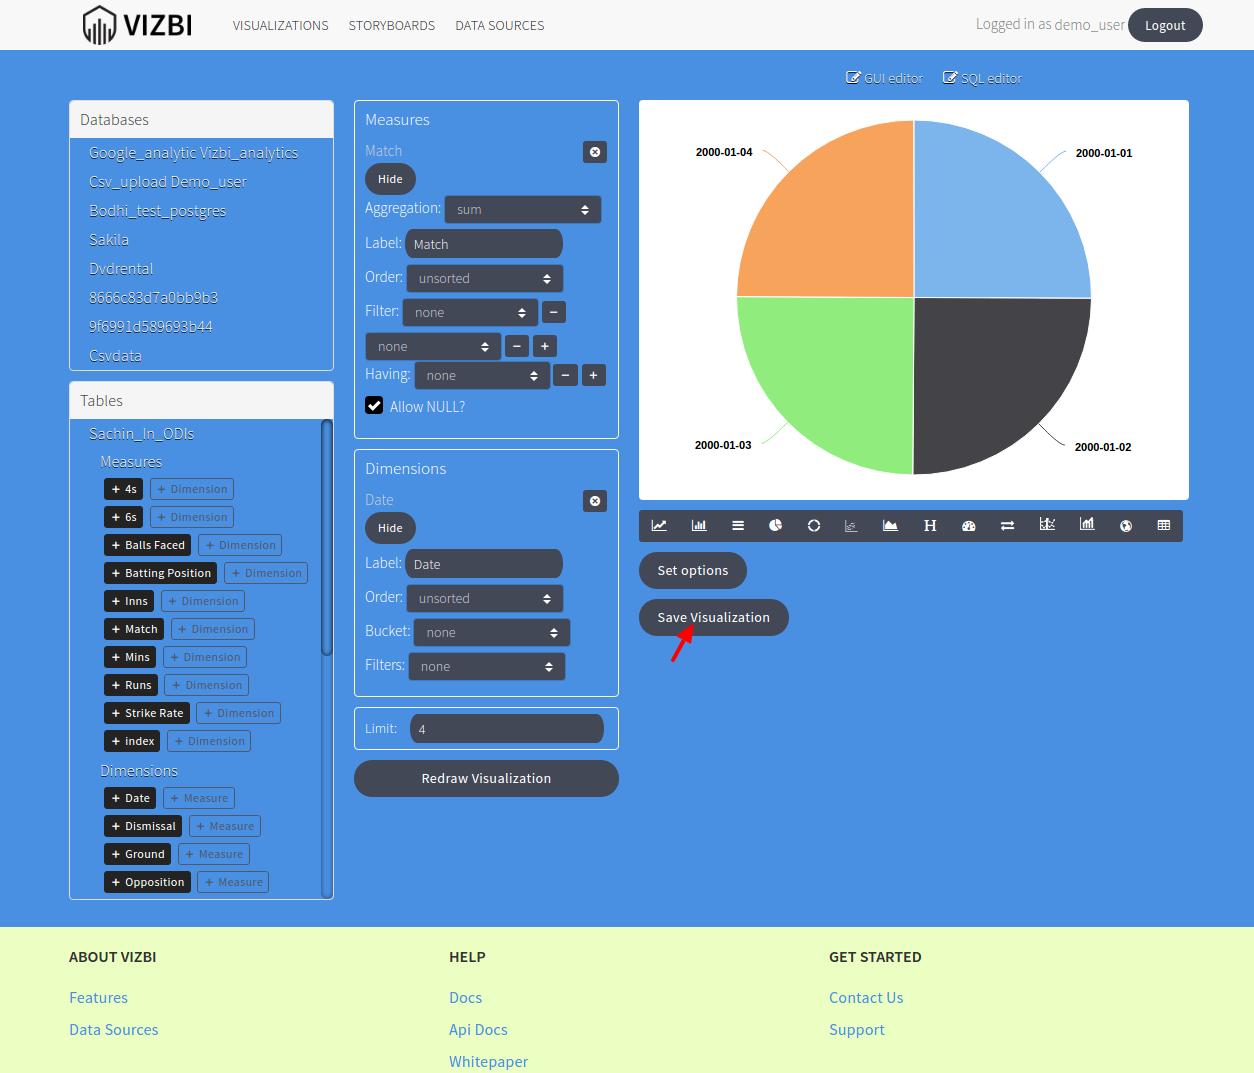
- To save the visualization, click on Save Visualization.
- Enter the visualization name and description and Save Changes